

5 Real Estate Return Metrics for Multifamily Syndicators
A deal can have a strong projected IRR and still distribute little cash for years. Another deal can pay steady distributions but create limited profit at sale. Neither number tells the whole story.
For multifamily syndicators, real estate return metrics help answer different questions: Is the purchase price reasonable? What cash can investors receive during the hold? How much value does the business plan create?
This guide explains cap rate, cash-on-cash return, IRR, equity multiple and yield on cost: how to calculate them, when to use them and what each can miss.
The metrics at a glance
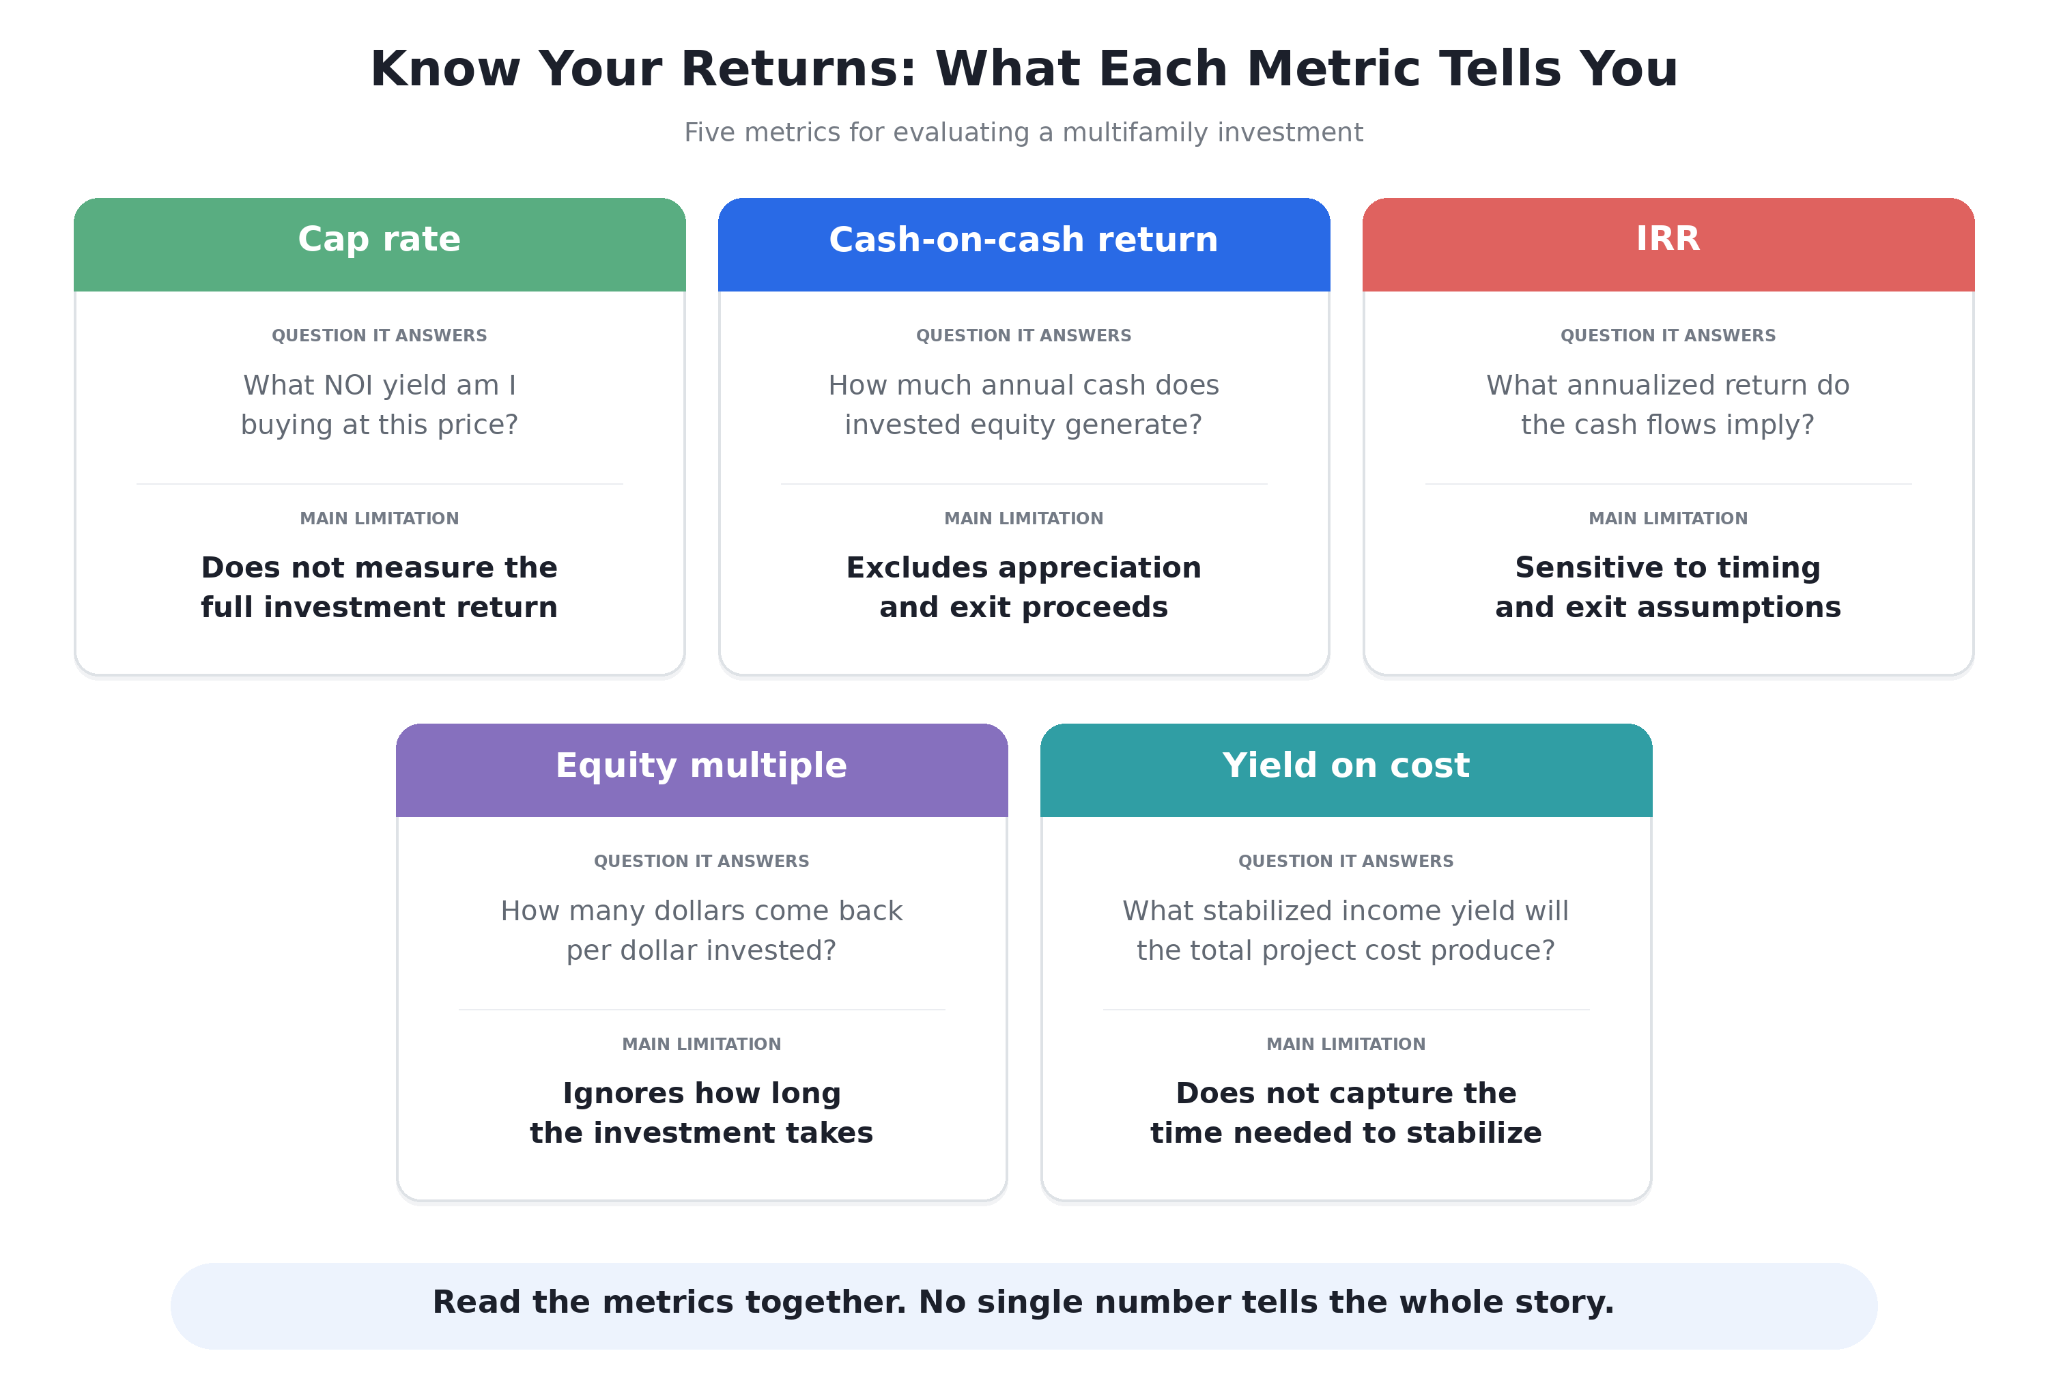
Before calculating them, separate the NOI from cash available to investors. Net operating income is property revenue after vacancy and credit losses, less operating expenses. It excludes debt service, depreciation, income taxes and capital expenditures. Investor distributions come after additional cash requirements and the deal’s distribution rules.
The examples below are hypothetical teaching examples, not market benchmarks or one continuous transaction.
1. Cap rate: understand the price of the income
Capitalization rate compares a property’s annual NOI with its purchase price or market value. It is an unlevered income yield, not the investor’s total return.
Cap rate = Annual NOI / Property price or value
An apartment property producing $600,000 in annual NOI at a $10 million purchase price has a 6% cap rate.
For a syndicator, this is a useful acquisition screen: compare the property’s pricing with similar buildings in the same market, using a consistent NOI basis. Do not compare one property’s trailing income with another’s projected post-renovation income without explaining the difference. CFA Institute’s CRE primer
A higher cap rate can reflect greater perceived risk or weaker growth expectations. A lower cap rate can reflect stronger demand or expected income growth. Neither proves a property is safe, risky or mispriced; the price and income assumptions still need scrutiny.
Cap rate also drives the projected exit. If forward annual NOI at sale is $750,000, a 6% exit cap implies a $12.5 million gross sale price. At 6.5%, that falls to approximately $11.54 million: about $962,000 less before selling costs and debt repayment.
Use this real estate return metric evaluate pricing, then test how a higher exit cap rate changes investor returns.
2. Cash-on-cash return: understand annual cash income
Cash-on-cash return compares annual pre-tax cash flow with the cash equity invested. Unlike cap rate, it reflects financing when the property uses debt.
Cash-on-cash return = Annual pre-tax cash flow / Cash equity invested
Suppose $4 million of equity supports a property that produces $600,000 in NOI. Annual debt service is $300,000, and another $60,000 is required for capital spending and reserve funding. That leaves $240,000 available before any further entity-level costs or waterfall allocations.
The aggregate equity cash yield is $240,000 / $4 million = 6%. This is not automatically the LP cash-on-cash return: sponsor fees, investor classes and the distribution waterfall can change what LPs receive. For an LP-facing figure, use the cash allocated to that LP or class and the corresponding invested equity. For a deeper dive, look here: Wall Street Prep’s cash-on-cash explainer
Syndicators use this metric to set distribution expectations. Show the annual schedule, not just a hold-period average: an average can hide low distributions during renovation.
Appreciation does not mechanically reduce cash-on-cash return. Instead, renovation spending, vacancies and retained reserves may reduce early cash available for distribution while the sponsor pursues future growth. Higher NOI can eventually support both distributions and property value.
Use this real estate return metric to evaluate pricing, then test how a higher exit cap rate changes investor returns.
3. IRR: account for the amount and timing of cash flows
Internal rate of return (IRR) is the discount rate that makes the net present value of an investment’s cash flows equal to zero. In practical terms, it measures the annualized return based on how much investors contribute, how much they receive and when those payments occur.
Suppose you invest $100,000 today, make no additional contributions and receive no payments until the investment ends. At the end of year three, you get back $150,000: your original $100,000 plus $50,000 in profit. Your IRR is approximately 14.47%.
If you instead get back that same $150,000 at the end of year five, your IRR falls to approximately 8.45%. You still earn $50,000 in total profit, but earning it over five years instead of three lowers your annualized return. This shows why timing matters: money received earlier can be reinvested to earn additional returns, a principle known as the time value of money.
Property Performance versus equity performance
Unlevered IRR uses property cash flows before financing, including acquisition costs, operating cash flows, capital spending, and net sale proceeds.
It helps compare the underlying real estate without different loan structures obscuring the comparison.
Levered IRR uses equity cash flows after financing. It accounts for the equity required, debt service, additional borrowing and repayment of outstanding debt. For syndication investors, net LP IRR should also reflect applicable fees and the waterfall. Here is a deeper dive on IRR: Wall Street Prep’s levered IRR explainer
Leverage does not always increase IRR. Consider a simplified one-year investment: a $100 asset generates $10 and sells for $100. Without debt, the return is 10%. Borrow $60 at 5% interest and the remaining $40 equity earns $7: 17.5%. Borrow at 15% instead and equity earns only $1: 2.5%. Assume no other costs or principal amortization before sale.
Debt changes both the equity required and what equity receives. Loan proceeds are not free profit.
Use unlevered IRR to evaluate the property and levered IRR to evaluate financing’s effect. A higher levered IRR alone does not prove that most of the return comes from debt.
4. Equity multiple: measure total money returned
For a fully realized investment, equity multiple compares total cash distributions to investors with the total equity contributions made towards the investment.
Equity multiple = Total cash distributions / Total equity contributed
Say an LP contributes $100,000, receives $25,000 during the hold and receives $155,000 at exit. Total distributions are $180,000, producing a 1.8x equity multiple. The profit is $80,000; the other $100,000 is returned capital.
Always include additional capital contributions in the denominator. If the same investor contributes another $20,000 but still receives $180,000, the multiple is 1.5x, not 1.8x. Doing so otherwise is misrepresentation.
Syndicators use equity multiple alongside IRR because it makes total proceeds easier to understand. Returning 1.8x in three years and in eight years creates the same multiple but different annualized returns. CFA Institute’s CRE primer
Before a sale, reported multiples may include what you think the investment is worth, not just cash received. Label that unrealized value clearly; it is not cash already received. Also distinguish gross deal returns (what the investment earns before manager fees) from net investor returns (what the investment earns after manager fees).
Use equity multiple to explain how much money comes back; pair it with IRR to explain the importance of timing.
5. Yield on cost: test the value-add plan
Yield on cost compares projected stabilized NOI with the property’s total project cost.
Yield on cost = Stabilized annual NOI / Total project cost
Suppose acquisition, renovations and other project costs total $12 million. Expected stabilized annual NOI is $840,000. Yield on cost is 7%.
For a value-add syndicator or developer, this measures how much annual operating income the completed project is expected to generate relative to its total cost. Clearly state which costs are included: purchase, closing, renovation, financing carry, fees, lease-up and contingency, as applicable. Together, these make up the total project cost—the bottom number in the calculation.
Comparing yield on cost with the cap rate of similar, stabilized properties helps you assess whether renovating offers enough additional reward to justify the time and risk, compared with buying an already stabilized property. The difference between yield on cost and the comparable market cap rate is called the spread.
If comparable stabilized properties trade at a 6% cap rate, the 7% yield on cost creates a 100-basis-point spread, or 1 percentage point. At that cap rate, $840,000 of annual NOI implies a property value of $14 million ($840,000 ÷ 6%), compared with $12 million in project costs. The estimated $2 million difference is before selling costs and other adjustments. It is not guaranteed investor profit.
Now increase total project costs by 10%, to $13.2 million, without changing NOI. Yield on cost falls to approximately 6.36%, and the spread narrows to about 36 basis points, assuming the market cap rate stays at 6%.
Use yield on cost to assess the renovation plan and see how cost overruns reduce the yield and narrow the spread. Pair it with IRR to account for timing: reaching the same stabilized yield in two years is different from taking five years to reach it.
Check the risks behind the return
Return projections need supporting checks:
- DSCR: Underwritten income divided by annual debt service, using the lender’s definitions. Tests payment coverage.
- LTV: Loan divided by property value. Tests leverage against collateral value.
- Debt yield: NOI divided by loan amount. Tests income relative to debt without relying on the loan’s interest rate.
These are financing-risk measures, not investor-return measures. They complement one another; none guarantees refinancing. See the OCC’s Commercial Real Estate Lending handbook.
A preferred return belongs in the deal-structure discussion. It defines distribution priority under the governing documents, not a guaranteed annual payment or an additional return to add to IRR.
Present the assumptions, not just the headline
Before sharing projected returns, identify:
- Whose returns are shown: the property’s, all equity investors’, or LP investors’ after fees.
- How long the investment lasts and when investors get paid.
- The income and cap rate used to estimate the sale price.
- Required investor funding, fees, and how payouts are split.
- How lower rents, higher renovation costs, or a delayed sale affect returns.
Cap rate explains pricing. Cash-on-cash explains annual income. IRR and equity multiple explain the full investment outcome. Yield on cost tests an improvement plan. Read together, they help a syndicator explain why a deal works and where it could fail.
For the inputs behind these calculations, continue with Cash Flow Portal’s CRE underwriting: 10 practical tips.
To start underwriting these real estate return metrics in your pro forma today, check out Cash Flow Portal’s underwriting software powered by AI.
This article is educational. All numerical examples are hypothetical and simplified; projected returns are not guarantees.
About the author

Zayd Shirzay
I’ve been interested in real estate since I was 16, have worked for a real estate developer, and am currently a second-year Urban Development student at Western University.
Related posts

Canada vs. U.S. Real Estate Syndication: Key Differences
By Zayd Shirzay | 09/27/26 | Guides for syndicators
Real estate syndication works on the same basic idea in Canada and the United States: a sponsor (General partner) finds and manages a deal while outside investors (Limited Partners) contribute capital. But the legal framework behind that raise can look very different across these two countries. In the U.S., syndicators often look at Regulation D, […]

AI for Capital Raisers
By Alex Field | 07/08/26 | Guides for syndicators
Most capital raisers already use Claude or ChatGPT every day. They draft investor emails with it, prep calls with it, think through a raise with it. The problem: the AI can’t see the data those questions are about. Ask it who your top investors are and it will guess. Cash Flow Portal’s new MCP server […]

Best CRM for Capital Raisers
By Alex Field | 07/01/26 | Guides for syndicators
Most CRMs were not built for raising capital. They were built to sell software, book demos, or run online stores. It shows the moment a syndicator tries to track accreditation, chase a half-finished investment, or move investor data by hand. Here’s what a CRM built for capital raisers looks like in practice. ▶ Watch the […]
Most popular posts
- AI for Capital Raisers07/08/26 | Guides for syndicators
- Best CRM for Capital Raisers07/01/26 | Guides for syndicators
 The 10 Hottest Cities to Invest in Real Estate Before 202507/20/22 | Announcements
 Bonus Depreciation for Real Estate Professionals09/09/21 | Passive investor guides
 Free tools to help you develop your real estate syndication blog in 202108/06/21 | Guides for syndicators
Categories


 Seattle, WA








Products
Capital raising
Why Cash Flow PortalEquity raising simplifiedFunds on Cash Flow PortalCo-sponsorsCustom brandingProperty management
BookkeepingBank syncQuickbooks integrationReportsOwner portalMaintenanceApplications & eSignTenant screeningCRMRent collectionTenant portalCommunicationFund admin
Fund administrationInstitutional fund administrationSPVsFund admin servicesIntegrated CPA servicesBanking
Integrated bankingLeads
New leadsAccounting
Accounting©2026 All rights reserved. Cash Flow Portal Inc.